At a Glance
Spirometry measures the volume and speed of air a person breathes out after filling the lungs completely. Its key results are the forced vital capacity (FVC), the total air blown out, and the forced expiratory volume in one second (FEV1), the part blown out in the first second. A healthy adult typically blows out about 75 to 80% of the FVC in the first second, so the FEV1/FVC ratio is usually above about 0.70.
- What it is
- A breathing test that measures exhaled air volume and flow over time
- Device
- Spirometer, today usually a flow sensor connected to a computer
- Graph produced
- Spirogram (volume against time) and flow-volume loop
- Key results
- FVC, FEV1, FEV1/FVC ratio and peak expiratory flow
- Cannot measure
- Residual volume, functional residual capacity and total lung capacity
- Part of
- Pulmonary function testing
On this page
- What Is Spirometry?
- What Is a Spirometer and How Does It Work?
- What Is a Spirogram?
- What Happens During a Spirometry Test?
- What Do FEV1, FVC and the FEV1/FVC Ratio Mean?
- What Is Spirometry Pre and Post Bronchodilator?
- How Are Spirometry Results Compared With Normal Values?
- What Patterns Can a Spirogram Show?
- What Is Spirometry Used For?
- Key Facts
- Quiz
- FAQ
What Is Spirometry?
Spirometry is a lung function test in which a person breathes into a device called a spirometer, which records how much air moves in and out of the lungs and how quickly it moves. The word comes from the Latin spirare, to breathe, and the Greek metron, measure. It is simple, painless and quick, and it is the starting point of almost every assessment of how the lungs and airways are working.
Spirometry definition
In formal terms, spirometry is the measurement of the volume of air a person inhales or exhales as a function of time. The most important part is a forced maneuver: a full breath in followed by a breath out as hard, fast and completely as possible. From that one blow the spirometer calculates how big the usable lung volume is and how freely air flows out through the bronchi and bronchioles.
What spirometry tells and does not tell
Spirometry measures two things well: the size of the breath a person can move and the speed of airflow. Speed depends mainly on how open the airways are, so spirometry is especially good at revealing narrowed airways. It does not show gas exchange in the alveoli, and it cannot measure the air that always stays in the lungs.
Explained simply
Think of the lungs as a balloon attached to a straw. Spirometry asks two questions: how much air the balloon holds when it is filled and then emptied as far as possible, and how fast it empties through the straw. A smaller balloon gives a smaller total, and a pinched straw gives a slower flow. The spirometer measures both and draws them as a curve.
What Is a Spirometer and How Does It Work?
A spirometer is the instrument used in spirometry; it measures the volume of air breathed in or out, either directly or by measuring airflow and adding it up over time. Modern devices range from desktop systems in hospital laboratories to small handheld units used in clinics.
Volume spirometers
The earliest spirometers measured volume directly. In the classic water-sealed design, a light bell floated upside down in a tank of water and rose and fell as a person breathed into it, and a pen attached to the bell traced the movement on a rotating drum. This trace was the original spirogram. The English physician John Hutchinson built such a device in the 1840s and used it to measure the vital capacity of thousands of people, a term he introduced.
Flow-sensing spirometers
Most spirometers today measure flow instead. Air passes through a sensor, such as a fine mesh that creates a tiny pressure drop, a small turbine that spins with the airflow, or an ultrasonic sensor that times sound pulses across the airstream. A computer converts the flow signal to volume by adding it up over time and draws both graphs instantly. These devices are small and easy to clean, and they use disposable mouthpieces and filters between people.
Incentive spirometer
An incentive spirometer, the plastic device with a floating ball or piston often given after surgery, shares the name but is not a measuring instrument. It shows a person how deep a breath they are taking, but it does not produce a spirogram or the results described on this page.
What Is a Spirogram?
A spirogram is the graph a spirometer produces, showing the volume of air breathed in or out on one axis against time on the other. Two kinds of graph are used, and together they show both how much air moves and how fast.
Volume-time spirogram
In a forced blow, the volume-time curve rises steeply in the first second, then bends and flattens into a plateau as the lungs empty. The height of the plateau is the forced vital capacity, and the height reached at exactly one second is the FEV1. In healthy adults the curve is steep and reaches its plateau within a few seconds, while a curve that keeps creeping upward for many seconds shows slow emptying.
Flow-volume loop
The flow-volume loop plots airflow against volume. During the forced breath out, flow shoots up to a sharp peak almost at once, the peak expiratory flow, then falls in a fairly straight line as the lungs empty. The breath in that follows is drawn below the line as a rounded curve. Because the shape of the loop changes in typical ways when airways are narrowed, it is often more revealing than the numbers alone.
Lung volumes on a slow spirogram
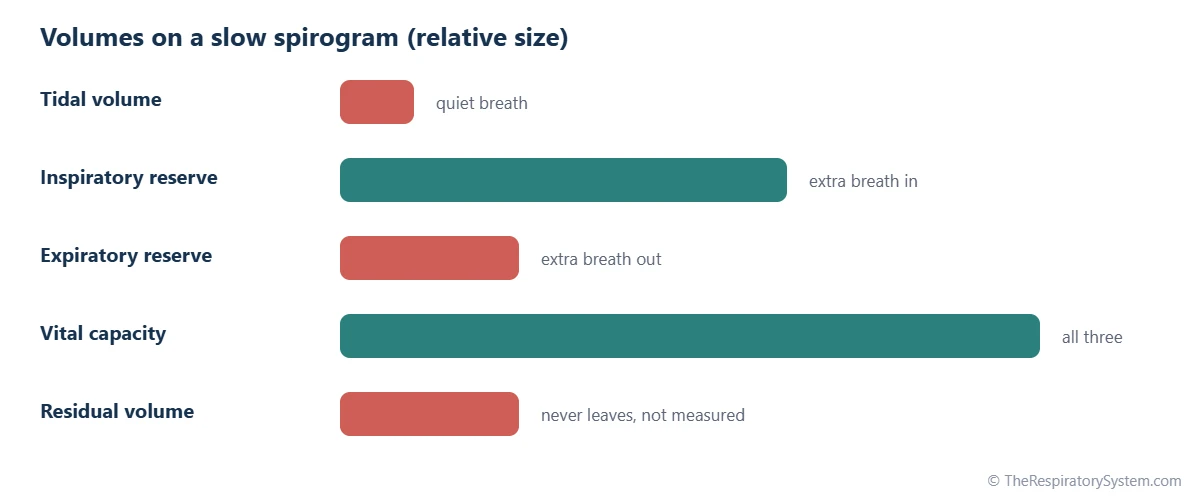
When a person breathes quietly and then takes the deepest possible breath in and out, the trace shows the standard lung volumes and capacities: the tidal volume of each normal breath, the inspiratory and expiratory reserve volumes, and the slow vital capacity. The residual volume, about 1.2 liters that stays in the lungs even after the hardest breath out, never leaves the lungs and so cannot appear on any spirogram.
What Happens During a Spirometry Test?
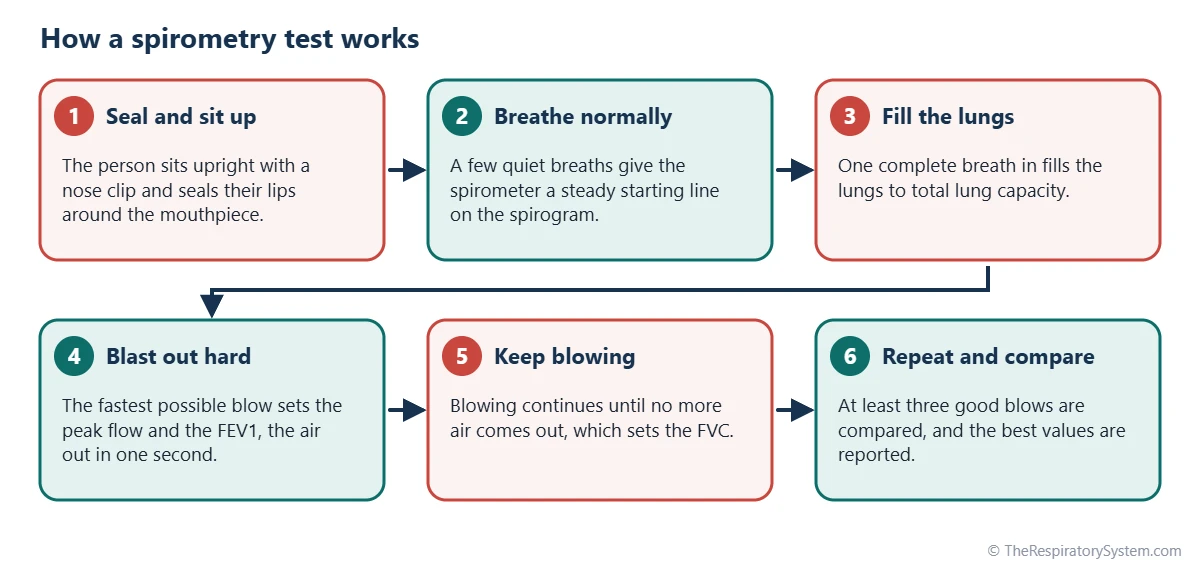
During a spirometry test, a person sits upright, seals their lips around a mouthpiece and, after a few calm breaths, breathes in as deeply as possible and then blows out as hard, fast and fully as they can, while a trained technician coaches them. The whole test usually takes about 15 to 30 minutes, including repeat blows.
The forced maneuver
- Setting up: the person sits upright with a clip on the nose so that all air passes through the mouthpiece.
- Quiet breathing: a few normal breaths let the device record a steady starting point.
- Full breath in: the person fills the lungs completely, to total lung capacity.
- Hard, fast blast: they blow out as forcefully as possible from the very first moment, which sets the peak flow and FEV1.
- Keep blowing: they keep pushing until no more air comes out, often for 6 seconds or longer in adults, which sets the FVC.
- Repeat: the blow is repeated, usually at least three times, so the results can be checked against each other.
How quality is checked
Because spirometry depends on effort, international technical standards define what counts as a good blow: a sharp start, no coughing in the first second, no early stop and a clear plateau at the end. The two best results for FVC and FEV1 should agree closely, typically within about 150 milliliters. The highest values from acceptable blows are reported, and the technician notes any problem with effort or technique.
How it feels
A forced blow takes effort, and some people feel briefly lightheaded or start coughing after several attempts. Spirometry involves no needles and no radiation. The test may be postponed shortly after certain operations, eye surgery or heart events, because the hard blow briefly raises pressure in the chest and head.
What Do FEV1, FVC and the FEV1/FVC Ratio Mean?
FVC is the total volume of air a person can blow out after a full breath in, FEV1 is the part of that volume blown out in the first second, and the FEV1/FVC ratio is the fraction of the total that leaves in that first second. Together they describe how big the usable lung volume is and how freely air flows out.
Forced vital capacity (FVC)
FVC is the largest volume a person can exhale with maximal force after maximal inhalation. It is usually close to the slow vital capacity measured with a relaxed breath. In healthy young adults it is typically around 4 to 5 liters in men and around 3 to 4 liters in women, but the expected value depends strongly on height, age and sex.
Forced expiratory volume in one second (FEV1)
FEV1 is the volume blown out in the first second of the forced breath. It falls when the airways are narrowed, because narrow tubes slow the escape of air, and it also falls when the lungs are simply smaller. FEV1 is the single most widely used number for describing how much airflow is limited.
The FEV1/FVC ratio
The FEV1/FVC ratio shows whether a low FEV1 comes from narrow airways or from small lungs. Healthy adults blow out about 75 to 80% of their FVC in the first second, and the ratio slowly falls with age. A ratio below about 0.70 is the cutoff many guidelines have used to define airflow obstruction, although newer standards compare it with an age-adjusted lower limit of normal. The ratio is sometimes called the Tiffeneau index after the French physician who helped introduce it in the late 1940s.
Other measurements
- Peak expiratory flow (PEF): the fastest flow reached during the blow, at the very start.
- FEF25-75: the average flow over the middle half of the FVC, sensitive to smaller airways but quite variable.
- Slow vital capacity (SVC): the same volume as FVC but breathed out without force.
| Measurement | What it is | Typical value | Measured by spirometry? |
|---|---|---|---|
| FVC (forced vital capacity) | Total air blown out with force after a full breath in | About 4 to 5 L in men, 3 to 4 L in women | Yes |
| FEV1 | Air blown out in the first second of the forced breath | About 75 to 80% of FVC | Yes |
| FEV1/FVC ratio | Fraction of FVC blown out in the first second | Usually above about 0.70; falls with age | Yes (calculated) |
| PEF (peak expiratory flow) | Fastest airflow, reached at the start of the blow | Depends on height, age and sex | Yes |
| FEF25-75 | Average flow over the middle half of the FVC | Varies widely between healthy people | Yes |
| Tidal volume | Air moved in a quiet breath | About 0.5 L | Yes (slow breathing) |
| Inspiratory reserve volume | Extra air breathed in after a normal breath in | About 3 L | Yes (slow breathing) |
| Expiratory reserve volume | Extra air breathed out after a normal breath out | About 1.1 to 1.2 L | Yes (slow breathing) |
| Residual volume | Air left in the lungs after a maximal breath out | About 1.2 L | No, needs other tests |
| Total lung capacity | All the air the lungs hold after a maximal breath in | About 6 L | No, needs other tests |
| Source: Typical values for a healthy young adult man unless stated; predicted values depend on age, height and sex. Our editors | |||
What Is Spirometry Pre and Post Bronchodilator?
Spirometry pre and post bronchodilator means doing the test twice: once at baseline and again after the person inhales a medicine that relaxes the smooth muscle of the airways, given by the testing staff, to see whether airflow improves. This is also called a bronchodilator response or reversibility test.
Why the test is repeated
The walls of the bronchi and bronchioles contain smooth muscle that can tighten and narrow the airways. A bronchodilator relaxes that muscle. If airflow limitation is caused largely by tightened muscle, the second test shows a clear rise in FEV1 or FVC; if the narrowing is fixed, the change is small. The second blow is done after a waiting period of several minutes so the medicine can take effect.
How a response is described
For many years, a rise in FEV1 or FVC of at least 12% and at least 200 milliliters was the usual definition of a significant response. A 2022 update to the international interpretation standards instead uses a change of more than 10% of the person's predicted value. In either case, the post-bronchodilator result is a measurement of airway behavior, and doctors interpret it together with symptoms and other findings rather than on its own.
Other challenge tests
Some laboratories do the reverse: they measure how much FEV1 falls after the airways are exposed to a substance or to exercise that can trigger narrowing in sensitive airways. These bronchial challenge tests are performed only under supervision in a testing laboratory.
How Are Spirometry Results Compared With Normal Values?
Spirometry results are compared with predicted values, the typical results of healthy people of the same age, height and sex, calculated from large reference studies. Each measured number is then expressed as a percentage of predicted, as a z-score, or against a lower limit of normal.
What sets predicted values
- Height: taller people have larger chests and lungs, so their predicted volumes are higher.
- Age: lung function rises through childhood and adolescence, peaks in the early to mid 20s and then declines slowly for the rest of life.
- Sex: at the same height, men have slightly larger lung volumes on average.
- Reference equations: widely used equations come from the Global Lung Function Initiative, which pooled data from many countries. Recent versions move away from adjusting results by race or ethnicity.
Percent predicted and the lower limit of normal
A result of 100% predicted means a person exactly matches the average for people like them. For many years, values of about 80% of predicted or more were treated as normal. Current standards prefer the lower limit of normal, the value below which only about 5% of healthy people fall, because a fixed percentage can misjudge results in very young and older people. The z-score expresses the same idea as the number of standard deviations from the average.
Why a single number is not a diagnosis
Healthy people vary, and a result just outside the expected range may be normal for that person. Doctors read spirometry alongside symptoms, examination, imaging and other lung function tests, and they compare results over time, which often says more than one measurement.
What Patterns Can a Spirogram Show?
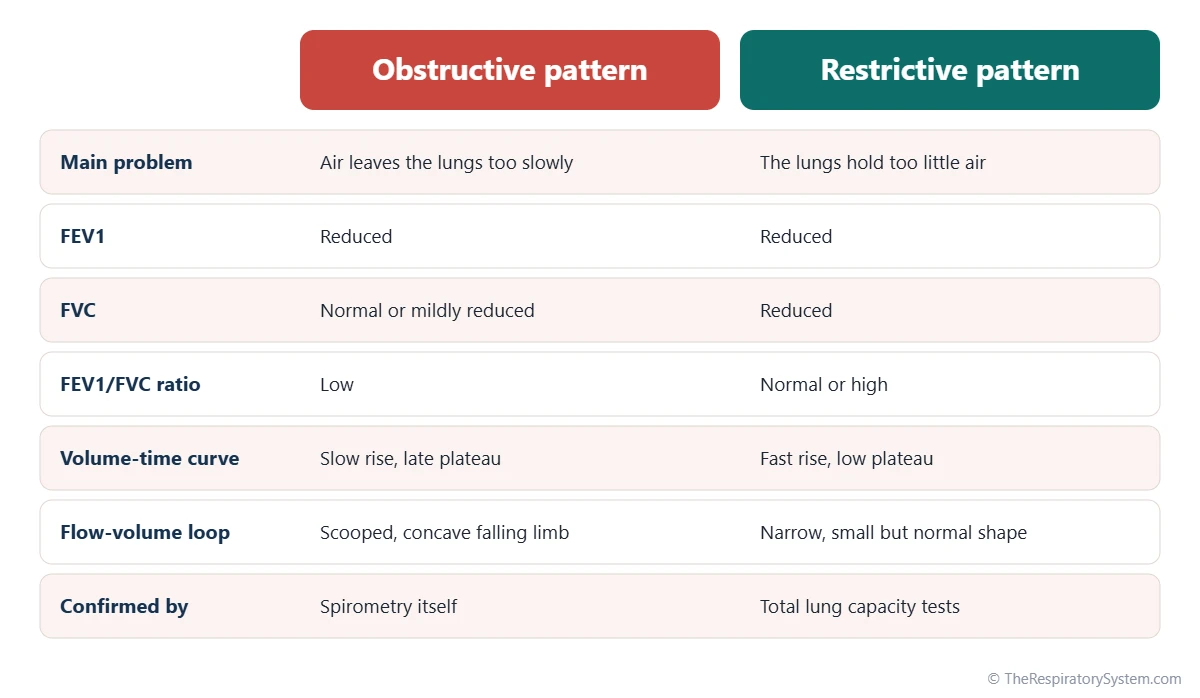
A spirogram can show a normal pattern, an obstructive pattern in which air leaves the lungs too slowly, a restrictive pattern in which the lungs hold too little air, or a mix of both. These patterns describe airflow and volume; they point to groups of possible causes rather than to a single disease.
Obstructive pattern
In an obstructive pattern, FEV1 is reduced much more than FVC, so the FEV1/FVC ratio is low. The volume-time curve rises slowly and takes a long time to reach its plateau, and the falling part of the flow-volume loop sags inward, a shape often described as scooped or concave. This pattern reflects narrowed or collapsing airways, as in asthma and COPD.
Restrictive pattern
In a restrictive pattern, FVC is reduced while the FEV1/FVC ratio stays normal or even high, because the smaller amount of air still leaves quickly. The flow-volume loop looks like a narrow, small version of the normal shape. A restrictive pattern on spirometry only suggests restriction; confirming it requires measuring total lung capacity with other tests. Causes include stiff lung tissue, as in pulmonary fibrosis, and problems of the chest wall or breathing muscles.
Other patterns
- Mixed pattern: features of both obstruction and restriction.
- Upper airway obstruction: a narrowing of the larynx or trachea can flatten the top or bottom of the flow-volume loop, giving it a box-like shape.
- Nonspecific pattern: FEV1 and FVC are both reduced with a normal ratio, while total lung capacity is normal.
Our page on obstructive vs restrictive lung disease explains how the two groups of conditions differ.
What Is Spirometry Used For?
Spirometry is used to detect airflow limitation, help confirm conditions such as asthma and COPD, follow how lung function changes over time and check lung function before treatments or surgery. It is also used in workplace health programs and in research.
Common uses
- Explaining symptoms: for a long-lasting cough, wheezing or breathlessness, spirometry shows whether airflow is limited.
- Confirming obstruction: a low FEV1/FVC ratio after a bronchodilator is part of the definition of COPD in major guidelines.
- Monitoring: repeated tests show whether lung function is stable, improving or declining.
- Before surgery: results help estimate how well a person will tolerate operations that affect breathing, including lung surgery.
- Workplace and research: people exposed to dust or fumes at work may be tested regularly, and spirometry is a standard measure in lung health studies.
What spirometry cannot measure
Spirometry measures only air that moves in and out. The residual volume, and therefore total lung capacity, need body plethysmography or gas dilution tests. Gas exchange is assessed separately with a diffusing capacity test, blood gases or oxygen saturation, and the matching of air and blood flow is described by the ventilation-perfusion ratio.
Spirometry and smoking
In people who smoke, FEV1 usually declines faster with age than in people who never smoked. Repeated spirometry can track that decline over years. The test cannot tell how the lungs will change in the future, and anyone with ongoing breathing symptoms should see a doctor. Our respiratory diseases section describes the main conditions in more detail.
Key Facts
- Spirometry measures how much air a person can blow out after a full breath in and how fast it leaves the lungs.
- FVC is the total air blown out with force, and FEV1 is the part blown out in the first second.
- Healthy adults blow out about 75 to 80% of their FVC in the first second, and the FEV1/FVC ratio slowly falls with age.
- A low FEV1/FVC ratio is the hallmark of an obstructive pattern, as seen in asthma and COPD.
- Spirometry cannot measure the residual volume of about 1.2 liters, so total lung capacity needs other tests; see lung volumes and capacities.
- Results are compared with predicted values for a person's age, height and sex, ideally using a lower limit of normal.
- John Hutchinson built a water-sealed spirometer in the 1840s and introduced the term vital capacity.
Quick Quiz: Test What You Know About the Spirometry and the Spirogram
6 questions. Tap an answer to check it.
What does FEV1 stand for?
FEV1 is the forced expiratory volume in one second, the air blown out in the first second of a forced breath.
Which volume can spirometry NOT measure?
Residual volume never leaves the lungs, so it cannot be blown into a spirometer and needs other tests.
What does a low FEV1/FVC ratio usually indicate?
In obstruction, air leaves slowly, so a smaller fraction of the FVC is blown out in the first second.
What is a spirogram?
A spirogram is the graph a spirometer produces, showing volume against time or flow against volume.
Why is spirometry sometimes repeated after a bronchodilator?
Comparing results before and after a bronchodilator shows how much of the airflow limitation can be reversed.
In a restrictive pattern, what usually happens to the FEV1/FVC ratio?
Both FEV1 and FVC fall, but air still leaves quickly, so the ratio stays normal or becomes high.
Frequently Asked Questions
What is a spirometry test used for?
A spirometry test is used to find out whether airflow out of the lungs is limited, to help confirm conditions such as asthma and COPD, and to follow lung function over months or years. It is also used before some operations, in workplace health checks for people exposed to dust or fumes, and in research studies on lung health. It measures airflow and volume, not oxygen in the blood.
Is spirometry painful?
No. Spirometry involves no needles, no injections and no radiation. The person simply breathes into a mouthpiece. The forced breath out does take hard effort, and some people feel briefly tired, lightheaded or start coughing after several attempts. These effects usually pass within moments. The technician allows rest between blows and stops the test if a person feels unwell.
What is the difference between a spirometer and a peak flow meter?
A spirometer records the whole forced breath, giving FVC, FEV1, the FEV1/FVC ratio and full graphs. A peak flow meter is a simple handheld tube that measures only the fastest speed of air at the start of a forced blow. Peak flow readings are easy to take at home but vary with effort and cannot show the patterns that a full spirogram reveals.
What is a normal FEV1/FVC ratio?
In healthy adults the FEV1/FVC ratio is usually between about 0.75 and 0.85, meaning 75 to 85% of the forced vital capacity leaves in the first second. Children often have higher ratios, and the ratio slowly falls with age. Many guidelines have used 0.70 as a simple cutoff for airflow obstruction, while newer standards compare each person's ratio with an age-specific lower limit of normal.
Why do you have to blow out for so long in spirometry?
The FEV1 is set in the first second, but the FVC is only complete when the lungs have emptied as far as they can. In healthy young people that may take only a few seconds, but when airways are narrowed, air keeps trickling out for much longer. Blowing until a clear plateau appears, often at least 6 seconds in adults, makes sure the FVC is not underestimated.
Can spirometry results change from day to day?
Yes, a little. Effort, technique, time of day, recent infections and how well a person understood the instructions all affect results. In healthy people the day-to-day variation is small, which is why repeated blows in one session must agree closely. In conditions such as asthma, results can vary much more, because the airways themselves narrow and widen at different times.
Who performs and reads a spirometry test?
Spirometry is usually performed by a respiratory therapist, pulmonary function technologist, nurse or trained clinic staff member who coaches the person through each blow and checks quality. The results and graphs are then reviewed by a physician, often a lung specialist, who compares them with predicted values and with the person's symptoms and history before drawing any conclusion.
At what age can spirometry be done?
Most children can perform reliable spirometry from about age 5 or 6, once they can follow instructions and make a full, forceful blow. Some laboratories test younger children with special coaching and adapted standards. There is no upper age limit; older adults can be tested as long as they are able to make the effort, and reference values extend into old age.
Keep Exploring


