At a Glance
The ventilation-perfusion ratio (V/Q ratio) compares alveolar ventilation (V), the air reaching the gas-exchanging alveoli each minute, with perfusion (Q), the blood flowing through the lung capillaries each minute. At rest about 4 liters of air and about 5 liters of blood pass through the lungs each minute, so the overall V/Q ratio is about 0.8. A V/Q of zero is a shunt (blood but no air) and an infinite V/Q is dead space (air but no blood).
- What it compares
- Alveolar ventilation (V) with pulmonary capillary blood flow (Q)
- Typical value
- About 0.8 for both lungs together in a healthy adult at rest
- Range in an upright lung
- About 3 near the apex to about 0.6 near the base
- Extremes
- Zero = shunt (no air); infinite = dead space (no blood)
- Why it matters
- Mismatch is the most common reason blood oxygen falls in lung disease
- Part of
- Gas exchange and pulmonary circulation
On this page
- What Is the Ventilation-Perfusion Ratio?
- What Is a Normal V/Q Ratio?
- How Does the V/Q Ratio Change From the Top to the Bottom of the Lung?
- What Happens When the V/Q Ratio Is Low or High?
- What Is Ventilation Perfusion Mismatch?
- Ventilation Perfusion Mismatch vs Shunt: What Is the Difference?
- How Does the Body Keep Ventilation and Perfusion Matched?
- How Is the V/Q Ratio Measured?
- Common Conditions That Affect the V/Q Ratio
- Key Facts
- Quiz
- FAQ
What Is the Ventilation-Perfusion Ratio?
The ventilation-perfusion ratio is a number that tells how well the air delivered to a part of the lung matches the blood flowing through that part, written as V/Q. V stands for alveolar ventilation, the volume of fresh air reaching the alveoli per minute, and Q stands for perfusion, the volume of blood passing through the pulmonary capillaries per minute. Because gas exchange needs both air and blood in the same place at the same time, this ratio decides how much oxygen the blood can pick up.
V/Q ratio meaning
The letters come from standard physiology shorthand. A dot over the V and the Q in textbooks means "per minute", so the ratio compares two flows, not two volumes. A ratio of 1 would mean equal flows of air and blood; a ratio below 1 means more blood than air, and a ratio above 1 means more air than blood. The ratio has no units because liters per minute cancel out.
Ventilation perfusion ratio definition
In formal terms, the ventilation-perfusion ratio is the ratio of alveolar ventilation to pulmonary blood flow, either for the whole lung or for a single lung unit such as one alveolus and its capillaries. The whole-lung value is an average of millions of local ratios, some higher and some lower, which is why two people with the same overall ratio can exchange gases very differently.
Explained simply
Imagine a delivery depot where trucks (the blood) come to collect boxes (oxygen) brought in by conveyor belts (the air). If many trucks wait at a dock where the belt is broken, they leave empty. If a belt runs full speed at a dock with no trucks, the boxes are wasted. The V/Q ratio describes how well belts and trucks are matched at every dock in the lungs.
What Is a Normal V/Q Ratio?
A normal V/Q ratio for the whole lung is about 0.8 in a healthy adult at rest, because alveolar ventilation is about 4 liters per minute while the right ventricle pumps about 5 liters of blood per minute through the lungs. Values from about 0.8 to 1.0 are commonly quoted as the healthy overall range.
Where the numbers come from
Total air movement at rest, or minute ventilation, is roughly 6 liters per minute: a tidal volume of about 500 milliliters taken about 12 times a minute. About 150 milliliters of each breath only fills the conducting airways, the anatomical dead space, so only about 350 milliliters per breath reaches the alveoli. That leaves about 4 to 4.5 liters per minute of alveolar ventilation, which, divided by a cardiac output of about 5 liters per minute, gives a ratio near 0.8.
Why it is not exactly 1
A ratio slightly below 1 is not a defect. The body uses more oxygen than the carbon dioxide it makes, and the alveolar air is already in balance with the capillary blood at a ratio near 0.8, giving an alveolar oxygen pressure of about 100 mmHg and a carbon dioxide pressure of about 40 mmHg. Those are the typical alveolar values described on our partial pressure of gases page.
The overall number changes with activity. During hard exercise ventilation rises more than cardiac output, so the whole-lung ratio climbs above 1, as described on our exercise and the respiratory system page.
How Does the V/Q Ratio Change From the Top to the Bottom of the Lung?
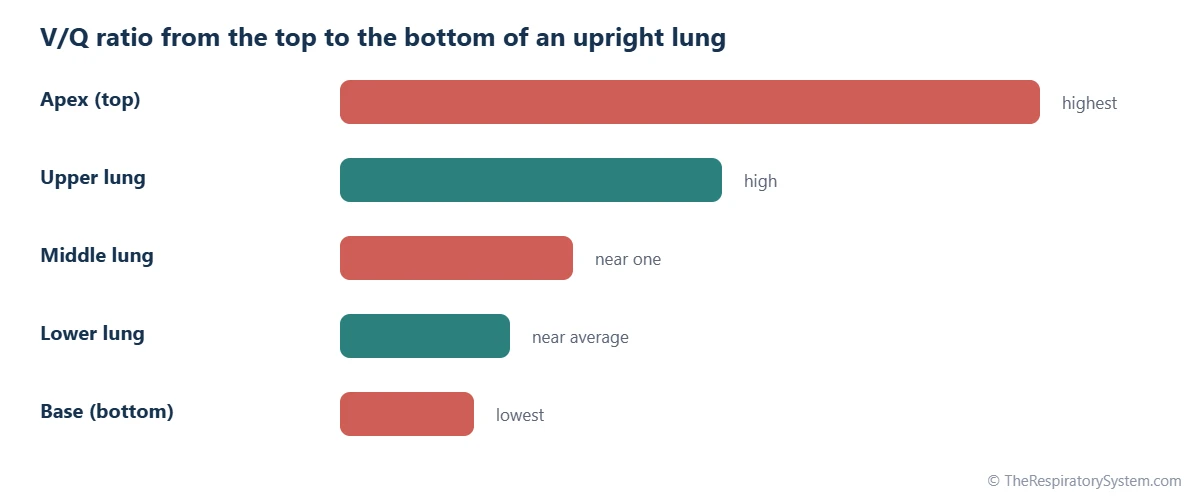
In an upright person the V/Q ratio is highest at the top of the lung, about 3, and lowest at the bottom, about 0.6, because gravity increases blood flow toward the base much more than it increases ventilation. Both air and blood favor the lower lung, but blood does so far more steeply.
Ventilation from apex to base
The weight of the lung makes the pressure in the pleural space more negative at the apex than at the base. Alveoli at the top are therefore held more open at rest and cannot expand much further, while alveoli at the base start smaller and stretch more with each breath. As a result, the lower lung receives more fresh air per unit of lung tissue.
Blood flow from apex to base
Blood is heavy, and the low pressure of the pulmonary circulation struggles to lift it to the apex. Physiologists describe three zones in the upright lung:
- Zone 1 (top): alveolar pressure could exceed arterial pressure and stop flow entirely. In healthy people this zone barely exists, but it can appear after major blood loss or during mechanical ventilation.
- Zone 2 (middle): arterial pressure exceeds alveolar pressure, which exceeds venous pressure, so flow depends on the difference between arterial and alveolar pressure.
- Zone 3 (bottom): both arterial and venous pressure exceed alveolar pressure, so blood flows continuously and generously.
Why the apex gets more air per blood
Because blood flow falls off much faster than ventilation toward the top, apical alveoli receive several times more air than blood, giving them high oxygen and low carbon dioxide levels. Basal alveoli receive more blood than air, so their gas is closer to that of the blood arriving from the body. Lying down shrinks these differences, and the regions nearest the bed, such as the back of the lungs when lying face up, then get the most blood.
What Happens When the V/Q Ratio Is Low or High?
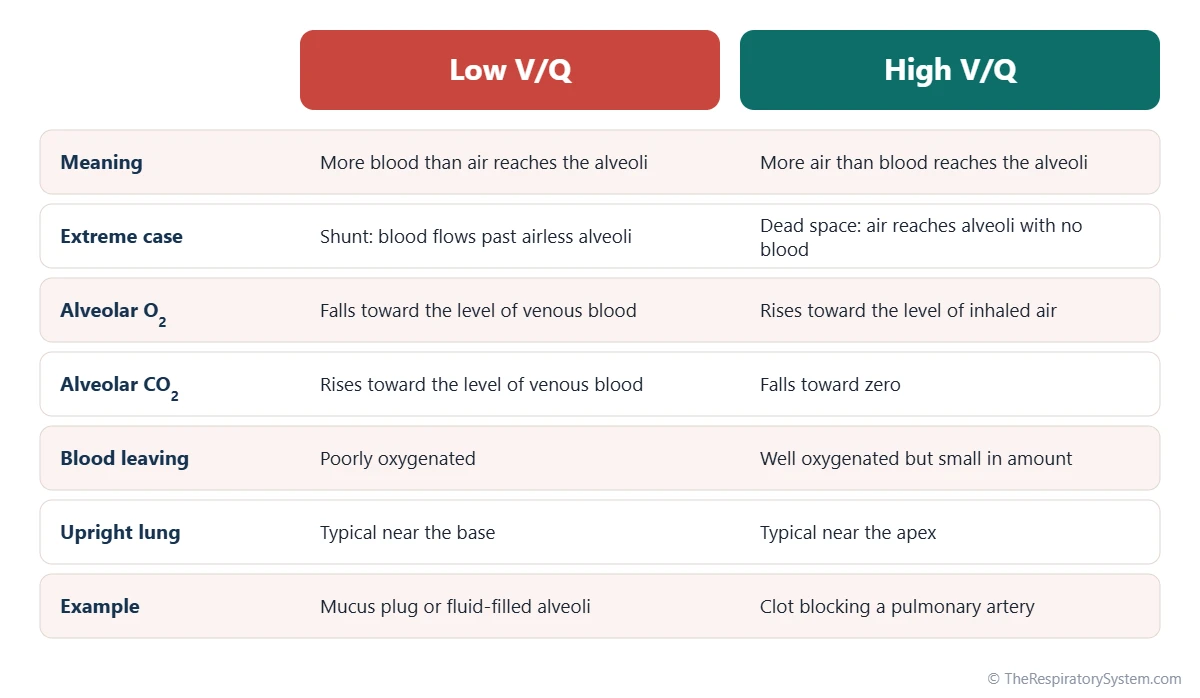
When V/Q is low, alveolar gas becomes more like the oxygen-poor blood returning from the body; when V/Q is high, alveolar gas becomes more like the inhaled air. The ratio of each lung unit therefore sets the oxygen and carbon dioxide levels in its alveoli and in the blood that leaves it.
Low V/Q: more blood than air
In a poorly ventilated unit, the blood removes oxygen faster than breathing replaces it and adds carbon dioxide faster than breathing clears it. Alveolar oxygen falls toward about 40 mmHg, the level in blood arriving from the right ventricle, and carbon dioxide rises toward about 45 mmHg. Blood leaving such a unit is poorly oxygenated. At the extreme, a unit with blood flow but no ventilation has a V/Q of zero, called a shunt.
High V/Q: more air than blood
In a well-ventilated but poorly perfused unit, fresh air arrives faster than the blood can use it. Alveolar oxygen rises toward the level of humidified inhaled air, about 150 mmHg, and carbon dioxide falls toward zero. The small amount of blood that does pass is well oxygenated, but much of the air is wasted. At the extreme, a unit with ventilation but no blood flow has an infinite V/Q and acts as alveolar dead space.
The V/Q spectrum
Physiologists picture every lung unit sitting somewhere on a line from shunt (V/Q of zero) to dead space (V/Q of infinity), with ideal matching in between. A healthy lung keeps most of its units clustered near the middle. The table below shows typical gas values along this spectrum, and our external and internal respiration page shows how the blood leaving the lungs goes on to supply the tissues.
| Lung unit or situation | V/Q ratio | Alveolar PO2 (mmHg) | Alveolar PCO2 (mmHg) | What it means |
|---|---|---|---|---|
| Shunt (blood, no air) | 0 | About 40 | About 45 | Alveolar gas equals oxygen-poor blood from the body |
| Low V/Q unit | Below about 0.8 | Between 40 and 100 | Between 40 and 45 | Blood leaves the unit undersaturated with oxygen |
| Base of upright lung | About 0.6 | About 90 | About 42 | Most blood flow, slightly low V/Q |
| Whole lung at rest | About 0.8 | About 100 | About 40 | The typical average of all lung units |
| Apex of upright lung | About 3 | About 130 | About 28 | Little blood flow, plenty of air for it |
| High V/Q unit | Above about 1 | Between 100 and 150 | Between 0 and 40 | Part of the ventilation is wasted |
| Dead space (air, no blood) | Infinite | About 150 | About 0 | Alveolar gas equals humidified inhaled air |
| Source: Typical values for a healthy adult at rest at sea level, our editors | ||||
What Is Ventilation Perfusion Mismatch?
Ventilation perfusion mismatch, or V/Q mismatch, is an uneven match between air and blood across different parts of the lung, with some regions getting too little air for their blood flow and others too little blood for their air. It is the most common reason that blood oxygen falls in lung disease.
Why mismatch lowers oxygen
The problem lies in the shape of the oxygen-hemoglobin dissociation curve. Blood leaving well-ventilated units is already almost fully saturated, because hemoglobin sits on the flat top of the curve, so extra air there adds very little oxygen. Blood leaving poorly ventilated units is undersaturated. When the two streams mix in the pulmonary veins, the well-oxygenated blood cannot make up for the poorly oxygenated blood, and the mixture carries less oxygen than normal.
Why carbon dioxide is affected less
Carbon dioxide behaves differently. Its content in the blood rises and falls almost in a straight line with its partial pressure, so blood passing well-ventilated units can give off extra carbon dioxide and balance the units that retain it. The breathing centers sense even small rises in carbon dioxide through the respiratory chemoreceptors and increase ventilation, so in many cases of mismatch the carbon dioxide level stays near normal while oxygen falls. See our carbon dioxide transport page for how the blood carries this gas.
A small mismatch is normal
Even healthy lungs are not perfectly matched. The top-to-bottom gravity effect, plus a small amount of blood from the bronchial and heart muscle veins that drains directly into the left side of the heart without passing alveoli, explain why arterial blood usually has a slightly lower oxygen pressure than alveolar air. The gap is small in young adults and widens a little with age.
Ventilation Perfusion Mismatch vs Shunt: What Is the Difference?
A ventilation perfusion mismatch means some lung units have a low but not zero V/Q, while a shunt means blood passes through the lungs with no contact at all with ventilated alveoli, a V/Q of exactly zero. Both lower arterial oxygen, but they respond differently when the inhaled oxygen level is raised.
How a shunt behaves
In a true shunt, blood flows past alveoli that are completely filled with fluid or collapsed, or it bypasses the alveoli altogether through an abnormal connection. Because that blood never meets any air, raising the oxygen in the inhaled air does not reach it. Physiologists use this property to tell a shunt apart from mismatch: during a test with high oxygen, low-V/Q units eventually fill with oxygen, while shunted blood stays oxygen-poor.
How dead space behaves
Dead space is the opposite extreme. Air that reaches lung units with no blood flow, or that only fills the airways, takes no part in gas exchange. The anatomical dead space of the trachea and bronchi is normal, while extra alveolar dead space appears when blood flow to ventilated alveoli is blocked. Wasted ventilation mainly makes it harder to clear carbon dioxide, so breathing has to increase to compensate.
Comparing the three
- Low V/Q mismatch: some air, more blood. Lowers oxygen; usually responds well to a higher inhaled oxygen level.
- Shunt: blood with no air. Lowers oxygen; responds poorly to a higher inhaled oxygen level.
- Dead space: air with no blood. Wastes ventilation; tends to raise carbon dioxide unless breathing increases.
Our page on hyperventilation and hypoventilation covers a fourth cause of low oxygen, too little total breathing, which lowers oxygen and raises carbon dioxide in every alveolus at once.
How Does the Body Keep Ventilation and Perfusion Matched?
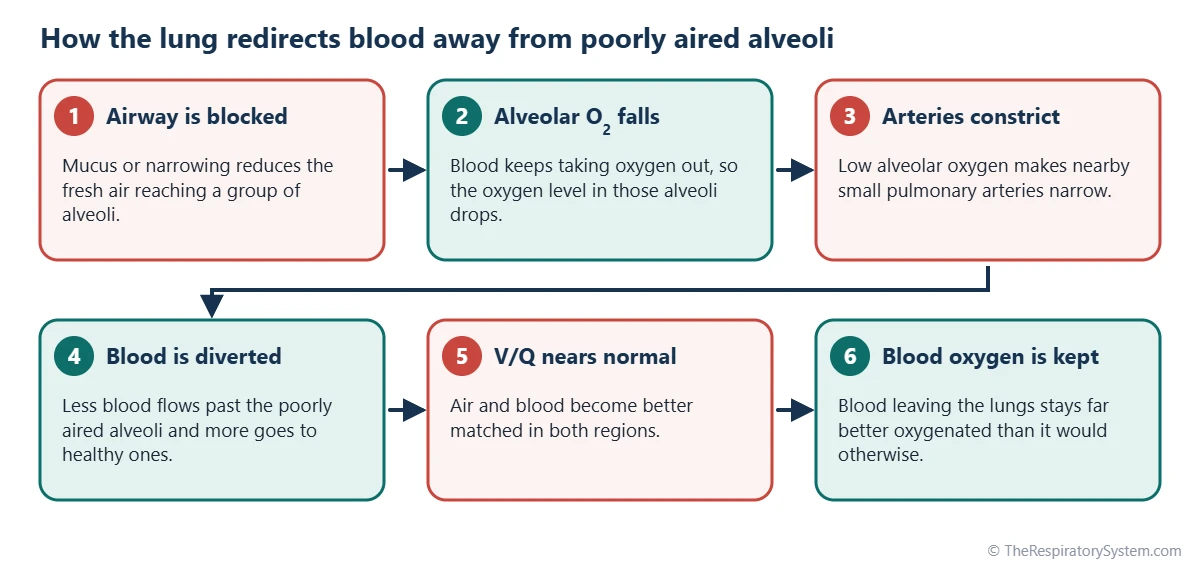
The lungs keep ventilation and perfusion matched mainly through hypoxic pulmonary vasoconstriction, in which small pulmonary arteries narrow wherever alveolar oxygen is low, steering blood toward better-ventilated regions. A weaker, opposite response narrows the airways that serve poorly perfused regions.
Hypoxic pulmonary vasoconstriction
In most of the body, low oxygen makes blood vessels widen to bring in more blood. In the lungs the reverse happens. When an area of lung receives too little air, the low oxygen level in its alveoli causes the smooth muscle of nearby small arteries to contract. Blood is pushed toward alveoli that are well aired, which raises the V/Q of the struggling area toward normal and protects the oxygen level of the blood leaving the lungs.
Airway responses
When a region of lung loses its blood supply, the carbon dioxide level in its alveoli falls because no blood is bringing carbon dioxide in. Low carbon dioxide makes the small airways of that region narrow slightly, sending more of each breath to perfused areas. This response is weaker than the vascular one but works in the same direction.
Adjustments with posture and exercise
When cardiac output rises during exercise, pulmonary artery pressure climbs a little, opening closed capillaries near the apex and widening open ones. Blood flow becomes more even from top to bottom, so ventilation and perfusion match more evenly. Posture changes also shift both air and blood toward whichever part of the lung is lowest.
When matching goes wrong
Hypoxic vasoconstriction helps when a small area is affected, but when large parts of both lungs are poorly ventilated, as at high altitude, the narrowing happens everywhere. Resistance in the whole pulmonary circulation then rises, which over time can strain the right side of the heart.
How Is the V/Q Ratio Measured?
The V/Q ratio is usually judged indirectly, from blood gas results and imaging, rather than measured unit by unit, because the lungs contain millions of tiny units each with its own ratio.
Blood gases and the A-a gradient
An arterial blood gas test measures the oxygen and carbon dioxide pressures in arterial blood. Comparing the measured arterial oxygen with the oxygen expected in the alveoli gives the alveolar-arterial (A-a) oxygen gradient. A small gradient means air and blood are well matched; a wider one points to V/Q mismatch, shunt or a diffusion problem. A pulse oximeter gives a simpler estimate of oxygen saturation but does not separate these causes.
Ventilation-perfusion scan
A V/Q scan is a nuclear medicine imaging test with two parts. In the ventilation part, the person breathes in a small amount of a radioactive gas or aerosol, and a camera shows where it spreads. In the perfusion part, tiny radioactive protein particles are injected into a vein and lodge briefly in the lung capillaries, showing where blood flows. Doctors compare the two images; an area with air but no blood flow is the classic pattern sought when a pulmonary embolism is suspected.
Research methods
In research settings, the multiple inert gas elimination technique (MIGET) estimates how blood flow and ventilation are spread across the whole range of V/Q values, from shunt to dead space. It is too complex for routine care but produced much of what is known about V/Q distribution. Simple breathing tests such as spirometry measure airflow, not V/Q, although they can show airway narrowing that leads to mismatch.
Common Conditions That Affect the V/Q Ratio
Most lung diseases disturb the V/Q ratio, either by blocking air from reaching alveoli that still receive blood (low V/Q) or by blocking blood from reaching alveoli that still receive air (high V/Q). Our respiratory diseases section covers each condition, and anyone with breathing symptoms should see a doctor.
- Asthma: narrowed, mucus-filled airways reduce ventilation to some regions while their blood flow continues, creating low-V/Q units.
- COPD: chronic bronchitis creates low-V/Q areas, while emphysema destroys alveolar walls and their capillaries, creating high-V/Q areas.
- Pneumonia: alveoli filled with fluid and cells can no longer be ventilated, so blood passing them behaves like a shunt.
- Atelectasis: collapsed alveoli receive blood but no air, another form of shunt.
- Pulmonary embolism: a clot blocks blood flow to ventilated lung, creating high-V/Q units and dead space.
- ARDS and pulmonary edema: fluid floods many alveoli at once, producing large shunts.
When these problems lower the oxygen level of the blood, the result is hypoxemia, described on our hypoxia and hypoxemia page.
| Problem | What fails | Effect on V/Q | Main gas effect |
|---|---|---|---|
| Airway narrowing (asthma, bronchitis) | Air reaching some alveoli | Lowers V/Q in affected regions | Lower blood oxygen |
| Alveoli filled with fluid (pneumonia, edema) | Air reaching alveoli entirely | V/Q of zero (shunt) | Lower blood oxygen, poorly helped by extra oxygen |
| Collapsed alveoli (atelectasis) | Alveoli stay closed | V/Q of zero (shunt) | Lower blood oxygen |
| Clot in a pulmonary artery | Blood reaching ventilated alveoli | Raises V/Q, adds dead space | Wasted ventilation; oxygen often falls too |
| Loss of alveolar walls (emphysema) | Both surface and capillaries | Mix of high and low V/Q units | Lower oxygen; carbon dioxide may build up |
| Low cardiac output | Blood flow to the apex | Raises V/Q at the top of the lung | More dead space |
| Source: Our editors, from standard respiratory physiology | |||
Key Facts
- The ventilation-perfusion ratio compares the air reaching the alveoli each minute with the blood flowing through the lung capillaries each minute.
- In a healthy adult at rest, about 4 liters of alveolar air and about 5 liters of blood per minute give an overall V/Q ratio of about 0.8.
- In an upright lung the V/Q ratio is about 3 at the apex and about 0.6 at the base, because gravity favors blood flow to the lower lung.
- A V/Q of zero is a shunt (blood without air), and an infinite V/Q is dead space (air without blood).
- V/Q mismatch is the most common cause of low blood oxygen in lung disease, and it lowers oxygen more than it raises carbon dioxide.
- Hypoxic pulmonary vasoconstriction narrows small arteries in poorly ventilated areas, steering blood toward well-ventilated alveoli.
- A V/Q scan compares where inhaled tracer reaches with where injected tracer flows, helping doctors look for a pulmonary embolism.
Quick Quiz: Test What You Know About the Ventilation-Perfusion Ratio
6 questions. Tap an answer to check it.
What does the V/Q ratio compare?
V is alveolar ventilation and Q is perfusion, the blood flowing through the lung capillaries, both per minute.
What is the typical overall V/Q ratio of a healthy adult at rest?
About 4 liters per minute of alveolar ventilation divided by about 5 liters per minute of blood flow gives about 0.8.
Where is the V/Q ratio highest in an upright person?
Blood flow falls off steeply toward the top of the lung, so the apex has the most air per unit of blood, a V/Q of about 3.
A lung unit with blood flow but no ventilation is called what?
A unit with perfusion but no ventilation has a V/Q of zero and is called a shunt.
What happens to small pulmonary arteries where alveolar oxygen is low?
Hypoxic pulmonary vasoconstriction narrows them and diverts blood to better-ventilated alveoli.
Which condition classically creates high V/Q areas and dead space?
A clot in a pulmonary artery blocks blood flow to alveoli that are still ventilated.
Frequently Asked Questions
What is the V/Q ratio in simple terms?
The V/Q ratio is a way of checking whether air and blood meet in the right amounts inside the lungs. V is the fresh air reaching the air sacs each minute and Q is the blood flowing past them each minute. When the two are well matched, the blood picks up oxygen efficiently. When one is much larger than the other, some air or some blood is wasted.
Is a high or low V/Q ratio worse?
Both are problems, but in different ways. Low V/Q units, and especially shunts, send poorly oxygenated blood into the arteries and lower blood oxygen directly. High V/Q units and dead space waste ventilation, so more breathing is needed to clear carbon dioxide. Low V/Q regions are the more common cause of low blood oxygen in everyday lung disease.
Why is the V/Q ratio higher at the apex of the lung?
In an upright person, gravity pulls blood toward the base of the lung, and the low-pressure pulmonary circulation sends only a small flow to the apex. Ventilation also favors the base, but much less steeply. So the apex gets a little air but very little blood, which gives it a V/Q ratio of about 3, while the base gets plenty of both and has a ratio of about 0.6.
What is a ventilation perfusion ratio graph?
A ventilation perfusion ratio graph usually plots ventilation and blood flow against height in the upright lung. Both lines rise from apex to base, but the blood flow line rises more steeply, so the V/Q line drawn on the same graph falls from top to bottom. Another common graph, the oxygen-carbon dioxide diagram, shows how alveolar gas pressures change as V/Q moves from zero to infinity.
Does lying down change the V/Q ratio?
Yes. Lying down removes most of the top-to-bottom gravity difference of the upright lung, so V/Q becomes more even from head to diaphragm. The difference moves instead between front and back. When lying face up, the back of the lungs, now lowest, receives more blood and more air, while the front receives less. Lying face down shifts the pattern the other way.
What is the difference between ventilation and perfusion?
Ventilation is the movement of air into and out of the lungs, and alveolar ventilation is the part of it that reaches the gas-exchanging air sacs. Perfusion is the flow of blood through the capillaries of the lungs, driven by the right side of the heart. Gas exchange needs both, and the ventilation-perfusion ratio describes how well they match.
Can V/Q mismatch happen in healthy people?
A small amount is always present. Gravity creates a natural range of V/Q values from the top to the bottom of the lung, and a little venous blood from the bronchial and heart muscle veins joins the arterial side without passing alveoli. These explain why arterial oxygen is usually a few mmHg lower than alveolar oxygen. The effect grows slowly with age.
Is a V/Q scan the same as a CT scan?
No. A V/Q scan is a nuclear medicine test that uses small amounts of radioactive tracers, one breathed in and one injected, to map airflow and blood flow in the lungs. A CT scan uses X-rays to make detailed cross-sectional images. For a suspected pulmonary embolism, a CT pulmonary angiogram with contrast dye is often used, and a V/Q scan is an alternative in some situations.
Keep Exploring


