At a Glance
The oxygen-hemoglobin dissociation curve plots hemoglobin oxygen saturation (percent) against the partial pressure of oxygen (PO2, in mmHg). It is S-shaped (sigmoid) because oxygen binding is cooperative; hemoglobin is about 97 to 98% saturated at the PO2 of about 100 mmHg found in the lungs, about 75% saturated at the 40 mmHg of resting tissues, and 50% saturated at the P50, about 26 to 27 mmHg. Carbon dioxide, acid, heat and 2,3-BPG shift the curve to the right.
- X axis
- Partial pressure of oxygen (PO2) in mmHg
- Y axis
- Hemoglobin oxygen saturation in percent
- Shape
- S-shaped (sigmoid), from cooperative oxygen binding
- P50
- About 26 to 27 mmHg in a healthy adult
- Right shift
- More CO2, more acid (lower pH), higher temperature, more 2,3-BPG
- Left shift
- Less CO2, higher pH, cooling, less 2,3-BPG, fetal hemoglobin, carbon monoxide
On this page
- What Is the Oxygen-Hemoglobin Dissociation Curve?
- What Does the Oxygen-Hemoglobin Dissociation Curve Show?
- Why Is the Oxygen-Hemoglobin Dissociation Curve S-Shaped?
- What Do the Flat and Steep Parts of the Curve Mean?
- What Is P50 in the Oxygen-Hemoglobin Dissociation Curve?
- What Causes a Right Shift of the Curve?
- What Causes a Left Shift of the Curve?
- How Does the Curve Change During Exercise, at Altitude and Before Birth?
- Common Conditions That Affect the Oxygen-Hemoglobin Dissociation Curve
- Key Facts
- Quiz
- FAQ
What Is the Oxygen-Hemoglobin Dissociation Curve?
The oxygen-hemoglobin dissociation curve, also called the oxyhemoglobin dissociation curve, is a graph of how much of the blood's hemoglobin is carrying oxygen at each oxygen pressure. Partial pressure of oxygen runs along the horizontal axis and percent saturation of hemoglobin up the vertical axis, and the line that joins them is shaped like a stretched letter S.
Hemoglobin is the iron-containing protein inside red blood cells that carries about 98% of the oxygen in arterial blood, as described on our oxygen transport page. Each hemoglobin molecule has four subunits, each with a heme group that can hold one oxygen molecule, so one hemoglobin can carry up to four. Saturation is the share of all these binding sites that are occupied: 100% means every site is full, 50% means half of them are.
Oxygen hemoglobin dissociation curve definition
In one sentence: the oxygen-hemoglobin dissociation curve is the relationship between the partial pressure of oxygen in the blood and the percentage of hemoglobin bound to oxygen. The word dissociation refers to oxygen coming off hemoglobin, but the same curve describes loading as well, read in the other direction.
Explained simply
Picture hemoglobin as a bus with four seats for oxygen. In the lungs, where oxygen is plentiful, the bus fills almost completely. In the body's tissues, where oxygen is scarce, passengers get off. The curve is a chart of how full the bus is at every stop. Its special shape means the bus fills easily in the lungs and empties easily exactly where cells need oxygen most.
What Does the Oxygen-Hemoglobin Dissociation Curve Show?
The oxygen-hemoglobin dissociation curve shows how much oxygen hemoglobin picks up in the lungs and how much it gives up in the tissues, by linking each oxygen pressure in the body to a saturation value. Reading a few points off the curve tells the whole story of oxygen delivery.
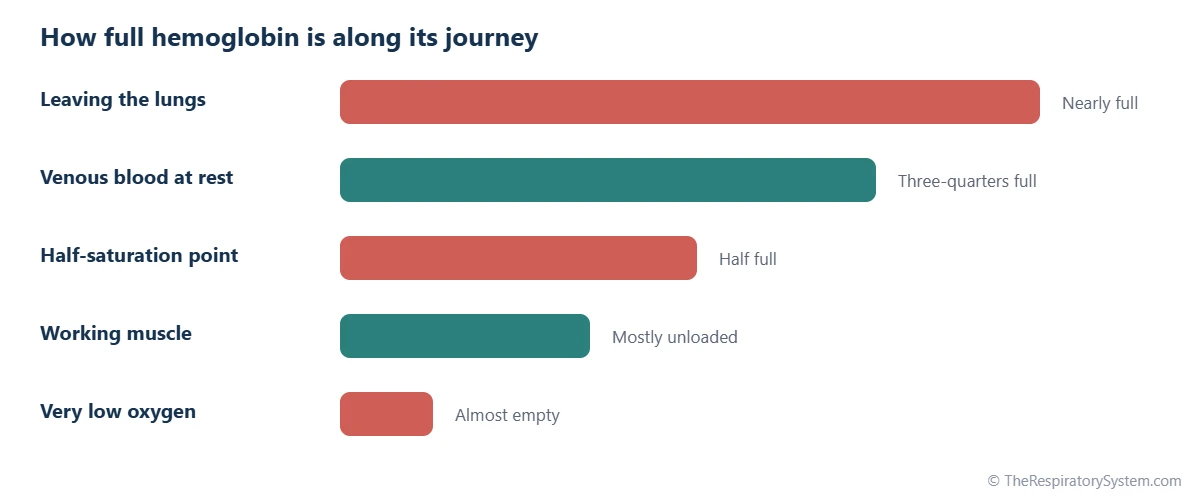
- In the lungs: blood leaving the alveoli has a PO2 of about 100 mmHg, and hemoglobin is about 97 to 98% saturated.
- In resting tissues: blood leaving resting tissues has a PO2 of about 40 mmHg, and hemoglobin is still about 75% saturated. Only about a quarter of the oxygen has been used.
- At the P50: at about 26 to 27 mmHg, hemoglobin is half saturated.
- In working muscle: during hard exercise, PO2 in muscle can fall to about 20 mmHg or lower, where hemoglobin releases most of its oxygen.
The unused oxygen in venous blood is a reserve. When a tissue becomes more active, its PO2 falls and it simply takes more oxygen from each passing red blood cell, without any need for the heart or lungs to respond first. The difference between arterial and venous saturation therefore shows how much oxygen the tissues are using.
What the curve does not show directly
Saturation is not the same as oxygen content. A person with anemia may have fully saturated hemoglobin but carry less oxygen overall, because there is less hemoglobin. The curve shows the percentage of hemoglobin that is loaded, while the total amount of oxygen also depends on how much hemoglobin there is, plus a small dissolved fraction.
Why Is the Oxygen-Hemoglobin Dissociation Curve S-Shaped?
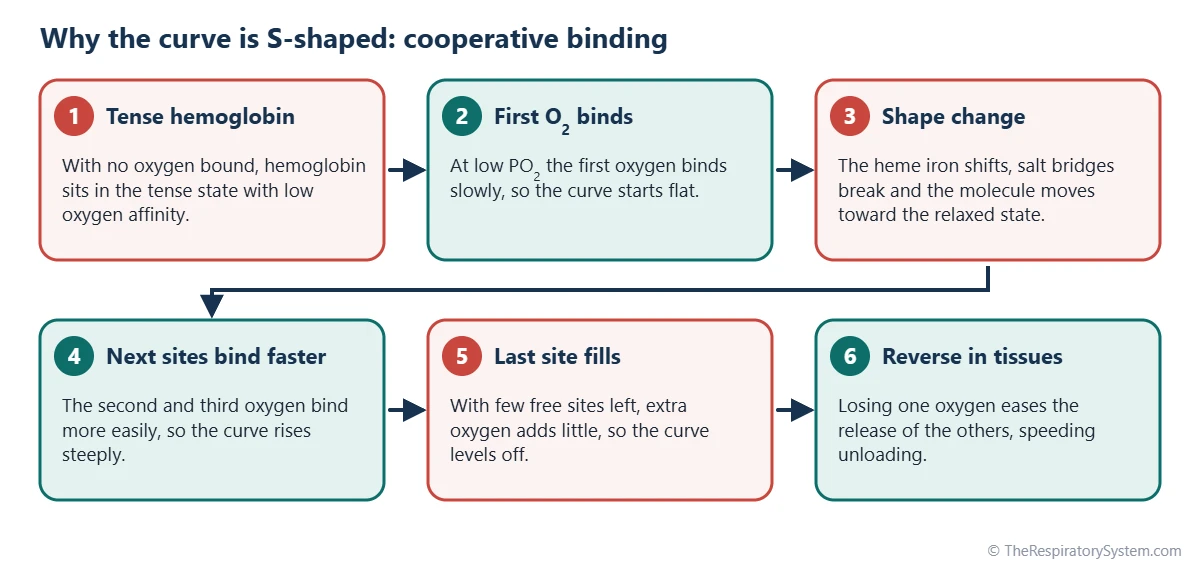
The curve is S-shaped because of cooperative binding: once one oxygen molecule binds to hemoglobin, the molecule changes shape and the remaining sites bind oxygen more easily. The result is a curve that rises slowly at very low oxygen pressures, very steeply in the middle and then levels off as hemoglobin approaches full saturation.
Tense and relaxed hemoglobin
Hemoglobin exists in two main shapes. With no oxygen bound, it sits in a tense, or T, state with low oxygen affinity, held together by salt bridges between its four chains. When oxygen binds to one heme group, the iron atom moves slightly into the plane of the heme ring, pulling on the protein chain and breaking some of those bonds. As more oxygen binds, the whole molecule flips into the relaxed, or R, state, which has a much higher affinity for oxygen.
The process also works in reverse. When hemoglobin loses one oxygen in the tissues, it shifts toward the tense state and gives up the others more easily. This cooperation is measured by the Hill coefficient, which is about 2.7 to 3 for adult hemoglobin, compared with 1 for a protein with no cooperation at all.
Comparison with myoglobin
Myoglobin, the oxygen-binding protein of muscle cells, has only one heme group and cannot cooperate. Its curve is a simple hyperbola that lies far to the left of hemoglobin's, so it holds oxygen tightly and releases it only when muscle PO2 falls very low. This makes myoglobin a good oxygen store inside muscle and hemoglobin a good oxygen carrier in the blood.
What Do the Flat and Steep Parts of the Curve Mean?
The flat upper part of the curve protects oxygen loading in the lungs, while the steep middle part allows large amounts of oxygen to be released in the tissues for small drops in oxygen pressure. Each part suits the place where hemoglobin works.
The plateau: a safety margin for loading
Above about 60 mmHg, the curve is nearly flat. At 60 mmHg, hemoglobin is still about 90% saturated, and raising PO2 from 60 to 100 mmHg adds only a little more oxygen. This means that moderate falls in alveolar PO2, such as at modest altitude or with mild lung disease, barely reduce the oxygen carried. It also explains why the peripheral chemoreceptors respond strongly to low oxygen only below about 60 mmHg, the point where saturation starts to fall quickly.
The steep part: easy unloading
Between roughly 10 and 50 mmHg, the curve is steep. In this range, a small fall in tissue PO2 produces a large fall in saturation, releasing a lot of oxygen. Active tissues, which use more oxygen and therefore have a lower PO2, automatically receive more. During strenuous exercise, working muscles can extract about three-quarters or more of the oxygen in their blood, compared with about a quarter at rest.
Why this shape is ideal
A carrier that bound oxygen weakly would fail to load in the lungs, while one that bound it tightly would fail to unload in the tissues. The S shape gives hemoglobin both: a high affinity at lung pressures and a much lower affinity at tissue pressures. The bars at the top of this page show how full hemoglobin is at each stage of its journey around the circulation.
What Is P50 in the Oxygen-Hemoglobin Dissociation Curve?
P50 is the partial pressure of oxygen at which hemoglobin is 50% saturated, and in a healthy adult at normal body temperature and pH it is about 26 to 27 mmHg. It is the standard single number used to describe where the curve sits and how strongly hemoglobin holds oxygen.
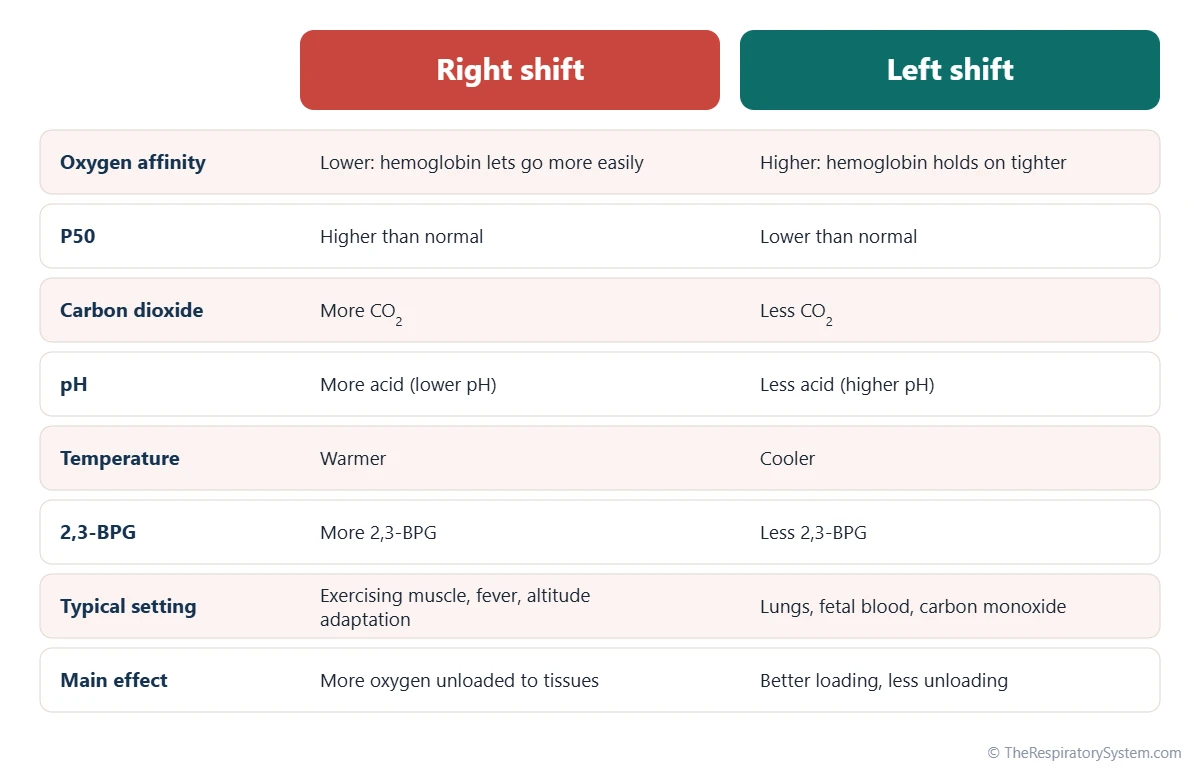
P50 works in the opposite direction from affinity. A higher P50 means hemoglobin needs more oxygen pressure to become half saturated, so it holds oxygen less tightly: the curve has shifted to the right. A lower P50 means hemoglobin holds oxygen more tightly: the curve has shifted to the left.
- Right shift: P50 rises above about 27 mmHg; affinity falls; more oxygen is released in the tissues.
- Left shift: P50 falls below about 26 mmHg; affinity rises; oxygen is held more tightly and released less easily.
Because the middle of the curve is steep, even a few mmHg change in P50 noticeably changes how much oxygen is unloaded at tissue pressures. The values in the table below are typical points on the normal adult curve at pH 7.4 and 37 degrees Celsius.
| PO2 (mmHg) | Saturation (%) | Where this occurs |
|---|---|---|
| About 100 | About 97 to 98 | Blood leaving the alveoli and arterial blood |
| About 80 | About 95 | Arterial blood in some healthy older adults |
| About 60 | About 90 | Edge of the flat part; below this saturation falls quickly |
| About 50 | About 84 | Upper end of the steep part |
| About 40 | About 75 | Mixed venous blood at rest |
| About 26 to 27 (P50) | 50 | Half saturation, the standard measure of affinity |
| About 20 | About 35 | Blood in hard-working muscle |
| About 10 | About 13 | Very low; most oxygen has been released |
| Source: Typical values for adult hemoglobin at pH 7.4 and 37 degrees Celsius, our editors | ||
What Causes a Right Shift of the Curve?
A right shift of the oxygen-hemoglobin dissociation curve is caused by more carbon dioxide, more hydrogen ions (lower pH), a higher temperature and more 2,3-bisphosphoglycerate (2,3-BPG) in red blood cells. Each of these lowers hemoglobin's affinity for oxygen, so oxygen is released more easily. Students often remember the list with the phrase "CADET, face right": CO2, Acid, 2,3-DPG (the older name for 2,3-BPG), Exercise and Temperature.
Carbon dioxide and hydrogen ions: the Bohr effect
Carbon dioxide and hydrogen ions both stabilize the tense state of hemoglobin. Hydrogen ions bind to specific amino acids on the globin chains, and carbon dioxide binds to their ends as carbamino groups. The rightward shift caused by acid and carbon dioxide is called the Bohr effect. It is most useful in active tissues, which make the most carbon dioxide and acid and so receive the most oxygen. The other side of this partnership, how oxygen affects the carriage of carbon dioxide, is described on our carbon dioxide transport page.
Temperature
Heat weakens the bond between oxygen and heme. Working muscles warm up, so they receive extra oxygen, and a fever has the same effect on the whole body.
2,3-BPG
2,3-BPG is a small molecule made in red blood cells during glucose breakdown. It fits into a pocket in the center of deoxygenated hemoglobin and holds it in the tense state. Its level rises over hours to days when oxygen supply is chronically low, such as at high altitude or in anemia, which pushes the curve to the right and improves oxygen release.
What Causes a Left Shift of the Curve?
A left shift is caused by the opposite changes, less carbon dioxide, fewer hydrogen ions (higher pH), a lower temperature and less 2,3-BPG, and also by fetal hemoglobin, carbon monoxide and methemoglobin. A left-shifted curve means hemoglobin holds oxygen more tightly: it loads well but releases less to the tissues.
- Low carbon dioxide and alkalosis: breathing faster than needed lowers blood carbon dioxide and raises pH, which shifts the curve to the left; see hyperventilation. In the lungs, the loss of carbon dioxide also produces a helpful local left shift that aids loading.
- Cold: a low body temperature strengthens oxygen binding.
- Low 2,3-BPG: red cells in stored donated blood gradually lose 2,3-BPG, so freshly transfused cells hold oxygen tightly until their levels recover.
- Fetal hemoglobin: the hemoglobin of a fetus binds 2,3-BPG poorly, so its curve lies to the left of the mother's. This lets oxygen pass from the mother's blood to the baby's across the placenta.
- Carbon monoxide: it occupies oxygen sites with a far stronger bond than oxygen and makes the remaining sites hold their oxygen tighter, which both lowers capacity and shifts the curve left.
- Methemoglobin: when the iron in heme is oxidized, it cannot carry oxygen, and the remaining normal sites hold on to oxygen more tightly.
A left shift is not always harmful. At very high altitude, the low carbon dioxide caused by fast breathing shifts the curve left, which helps hemoglobin load oxygen from thin air in the lungs. The table below summarizes the factors and their direction.
| Factor | Shifts right when | Shifts left when | Where it matters |
|---|---|---|---|
| Carbon dioxide (PCO2) | It rises | It falls | Active tissues; lungs |
| Hydrogen ions (pH) | Acid rises, pH falls | pH rises (alkalosis) | Active tissues; acid-base disorders |
| Temperature | It rises (exercise, fever) | It falls (cold, hypothermia) | Working muscle; whole body |
| 2,3-BPG | It rises (altitude, anemia) | It falls (stored blood) | Long-term adaptation |
| Type of hemoglobin | Some low-affinity variants | Fetal hemoglobin; some high-affinity variants | Placenta; inherited variants |
| Carbon monoxide | Does not shift it right | Present in the blood | Smoke and exhaust exposure |
| Methemoglobin | Does not shift it right | Present in the blood | Certain chemicals; rare inherited forms |
| Source: Standard physiology, our editors | |||
How Does the Curve Change During Exercise, at Altitude and Before Birth?
The curve moves with the body's needs: it shifts right in exercising muscle, it is reshaped over days at high altitude, and before birth the baby's hemoglobin sits on a curve to the left of the mother's. These adjustments let oxygen delivery keep up with very different conditions.
During exercise
In working muscle, carbon dioxide, acid and temperature all rise at once, shifting the local curve to the right just where oxygen is needed. At the same time, muscle PO2 falls onto the steep part of the curve. Together these changes let muscles extract far more oxygen from each liter of blood than at rest. Our page on how exercise affects the respiratory system describes the breathing side of this response.
At high altitude
At altitude, the PO2 of inhaled air falls, and on the flat part of the curve saturation is protected at first. Higher up, alveolar PO2 slides onto the steeper part and saturation falls. Fast breathing lowers carbon dioxide and shifts the curve left, helping loading in the lungs, while 2,3-BPG rises over days and pushes it right, helping unloading in the tissues. The balance between these effects is explained on our breathing at high altitude page.
Before birth
A fetus gets its oxygen from the mother's blood in the placenta, where PO2 is low. Fetal hemoglobin has a lower P50 than adult hemoglobin, so it can take oxygen from the mother's hemoglobin. After birth, fetal hemoglobin is gradually replaced by the adult form over the first months of life, as described on our development of the respiratory system page.
Measuring saturation
A pulse oximeter clipped to a finger estimates saturation from the color of the blood, reported as oxygen saturation (SpO2). Because of the curve's flat top, a reading in the high 90s can hide quite large changes in PO2, while a fall into the low 90s and below means PO2 has reached the steep part.
Common Conditions That Affect the Oxygen-Hemoglobin Dissociation Curve
Several conditions change either the position of the curve or how much oxygen the blood can carry at a given saturation. Our respiratory diseases section covers lung conditions in more depth, and anyone with symptoms should see a doctor.
- Carbon monoxide poisoning: carbon monoxide binds hemoglobin more than 200 times more strongly than oxygen, lowering the oxygen carried and shifting the curve left. Standard pulse oximeters cannot tell carbon monoxide-bound hemoglobin from oxygenated hemoglobin.
- Anemia: the curve keeps its shape, but there is less hemoglobin, so the blood carries less oxygen; rising 2,3-BPG shifts the curve somewhat to the right.
- Hypoxemia from lung disease: in conditions such as COPD or pneumonia, arterial PO2 can fall onto the steep part of the curve, where saturation drops quickly.
- Acidosis and alkalosis: changes in blood pH from breathing, kidney or metabolic problems shift the curve right or left.
- Methemoglobinemia: a condition, inherited or caused by certain chemicals, in which heme iron is oxidized and cannot carry oxygen.
- Abnormal hemoglobins: some inherited hemoglobin variants have an unusually high or low oxygen affinity, which moves the P50 away from the normal range.
When oxygen delivery falls short, cells cannot make enough energy, as explained on our why do we need oxygen page.
Key Facts
- The oxygen-hemoglobin dissociation curve plots hemoglobin saturation against the partial pressure of oxygen.
- The curve is S-shaped because oxygen binding to hemoglobin's four heme groups is cooperative.
- P50, the oxygen pressure at which hemoglobin is half saturated, is about 26 to 27 mmHg in a healthy adult.
- Hemoglobin is about 97 to 98% saturated in the lungs and still about 75% saturated in resting venous blood.
- More carbon dioxide, more acid, higher temperature and more 2,3-BPG shift the curve to the right, helping oxygen unload; this is linked to the Bohr effect.
- Fetal hemoglobin and carbon monoxide shift the curve to the left, so hemoglobin holds oxygen more tightly.
- The flat top of the curve protects oxygen saturation when alveolar PO2 falls moderately, while the steep middle speeds oxygen release in active tissues.
Quick Quiz: Test What You Know About the Oxygen-Hemoglobin Dissociation Curve
6 questions. Tap an answer to check it.
What does the oxygen-hemoglobin dissociation curve plot?
The curve shows percent hemoglobin saturation on the vertical axis against the partial pressure of oxygen on the horizontal axis.
What is the typical P50 of normal adult hemoglobin?
Adult hemoglobin is half saturated at a PO2 of about 26 to 27 mmHg.
Why is the curve S-shaped?
Each bound oxygen makes the next one bind more easily, producing a sigmoid curve.
Which change shifts the curve to the right?
More carbon dioxide lowers hemoglobin's oxygen affinity and shifts the curve right, part of the Bohr effect.
Why does fetal hemoglobin have a left-shifted curve?
Fetal hemoglobin binds 2,3-BPG weakly, so it has a higher oxygen affinity and can take oxygen from the mother's blood.
About how saturated is hemoglobin in mixed venous blood at rest?
At a venous PO2 of about 40 mmHg, hemoglobin is still about 75% saturated, leaving a reserve.
Frequently Asked Questions
What does a right shift in the oxygen-hemoglobin dissociation curve mean?
A right shift means hemoglobin has a lower affinity for oxygen, so at any given oxygen pressure it is less saturated and releases oxygen more easily. The P50 rises above its normal value of about 26 to 27 mmHg. Right shifts happen with more carbon dioxide, more acid, higher temperature and more 2,3-BPG, conditions found in active tissues, where extra oxygen release is useful.
What does a left shift mean?
A left shift means hemoglobin has a higher affinity for oxygen, so it is more saturated at any given oxygen pressure and holds on to oxygen more tightly. The P50 falls below normal. Left shifts occur with low carbon dioxide, alkalosis, cold and low 2,3-BPG, and are caused by fetal hemoglobin and carbon monoxide. Loading in the lungs is easier, but release in the tissues is reduced.
What is the difference between the oxygen-hemoglobin dissociation curve and the Bohr effect?
The dissociation curve is the overall graph linking oxygen pressure to hemoglobin saturation. The Bohr effect is one specific way that curve can move: more carbon dioxide and hydrogen ions lower hemoglobin's oxygen affinity and shift the curve to the right. In other words, the Bohr effect describes a change in the curve, while the curve itself describes hemoglobin's normal oxygen binding.
Why is the oxygen-hemoglobin dissociation curve not a straight line?
A straight line would mean each oxygen molecule binds independently with the same ease. In hemoglobin, the four binding sites influence each other: binding one oxygen changes the molecule's shape and makes the next one bind more easily. This cooperation produces an S shape, with a slow start, a steep middle and a flat top, instead of a straight or simple curved line.
What is the difference between SaO2 and PaO2?
PaO2 is the partial pressure of oxygen dissolved in arterial blood, measured in mmHg, while SaO2 is the percentage of hemoglobin in arterial blood that is carrying oxygen. The dissociation curve connects the two. In a healthy adult, a PaO2 of about 95 to 100 mmHg corresponds to an SaO2 of about 97 to 98%. A pulse oximeter estimates saturation and reports it as SpO2.
Does exercise shift the oxygen-hemoglobin dissociation curve?
Yes. In working muscles, carbon dioxide, acid and temperature all rise, which shifts the local curve to the right and lowers hemoglobin's affinity for oxygen exactly where demand is highest. Muscle PO2 also falls onto the steep part of the curve. Together these changes let exercising muscle extract much more oxygen from each liter of blood than it does at rest.
How does 2,3-BPG affect oxygen delivery?
2,3-BPG is a molecule made in red blood cells that binds in the center of deoxygenated hemoglobin and stabilizes its low-affinity tense state. More 2,3-BPG shifts the curve to the right, so hemoglobin releases more oxygen in the tissues. Its level rises over hours to days in conditions of chronically low oxygen supply, such as living at high altitude or having anemia.
Why does carbon monoxide shift the curve to the left?
When carbon monoxide binds to one of hemoglobin's four heme groups, it pushes the molecule toward its high-affinity relaxed state. The remaining heme groups then hold their oxygen more tightly and release it poorly in the tissues. Carbon monoxide therefore harms oxygen delivery twice: it takes up binding sites that should carry oxygen, and it makes the remaining oxygen harder to unload.
Keep Exploring


